 Yes, the result is obvious and you can say that there is no need to compare them. But, let’s do a deep Middleware analyse and calculate price/cost/performance results.
First of all I have decided to buy a new all in one PC. Normally I use Microsoft Windows PC for my daily business work and quite satisfied with Windows 10. But this PC would be my second PC with the purpose of using at home for my personal researches and developments. So I decided to use MAC OS X at this time. Then visited Apple Store and checked iMac 27inch 5K all in one PC. There are different configuration offers for this PC. At the beginning I thought “This would be my second PC and there is no need to buy the best configuration”. Apple Genius told me, If you want to buy a customised configuration you have to wait about one month” After all, I bought the beginner and cheaper configuration which was “3.2 GHz i5, 1TB Serial ATA Drive, 8GB Memory”.
And then my iMac 27inch 5K Display performance test journey had been started. After the first JSL performance result I changed my mind immediately and gave back “iMac i5” to Apple store because of weak performance. We can say that WebLogic and JSL (Java Server Loader) performance results on “iMac i5” changed my opinion for using i5. Now I am using “iMac 4.0 GHz i7” and this one has a remarkable performance test results and I am really satisfied with the current performance. Yes, I’ve paid additional cost, but I am totally happy with the result and it’s profitable for long term usage. If you’re deciding to buy a new PC think twice and don’t waste your money for long term. If you’re planing to use iMac for your business (I’m using for Java IDE’s, Application Servers, SOA Tools..) the i5 choice is not at your league.
And now I am going to share all the details about performance tests and the results, WebLogic configurations on iMac, Java Server Loader (Runs on WebLogic), benchmark results, iMac configurations…
I have also prepared a video tutorial for these WebLogic and JSL performance tests on iMac. Here is the URL: https://youtu.be/d0rEk9-AZ0k
iMac Configurations: 27-inch iMac with Retina 5K display: i5 3.2 GHz >> vs. << i7 4.0 GHz

Summary of iMac Hardware Configurations:
| Configuration | CPU | Disk | Memory | Price |
|---|---|---|---|---|
| Configuration-1: 27-inch iMac with Retina 5K Display – i5 | 3.2GHz quad-core Intel Core i5, Turbo Boost up to 3.6GHz | 1TB Serial ATA Drive @ 7200 rpm | 8GB 1867MHz DDR3 SDRAM – two 4GB | $1,799.00 |
| Configuration-2: 27-inch iMac with Retina 5K Display: i7 | 4.0GHz quad-core Intel Core i7, Turbo Boost up to 4.2GHz | 512GB Flash Storage (SSD) | 8GB 1867MHz DDR3 SDRAM – two 4GB | $2,749.00 |
iMac Performance Test Environment and Applied Tools & Technologies:

| Software & Tools | Version |
|---|---|
| Oracle WebLogic Application Server | 12c (12.2.1) |
| Java (JDK) | 1.8.0_92 |
| WLSDM: WebLogic Smart Dashboard & Monitoring | 2.1.8 |
| JSL (Java Server Loader) | 0.1.9 |
About the Performance Test Environment for Comparing iMac:
The tests were very realistic because I was planing to buy which iMac hardware I would buy by applying Java Server Loader (JSL) results. I had setup and installed Middleware infrastructure by using Java, WebLogic, WLSDM and JSL technologies. I did these setups for the both iMac PCs. Firstly installed infrastructure and configured WebLogic environment. After all, I’ve deployed JSL(Java Server Loader) for executing hardware performance tests.
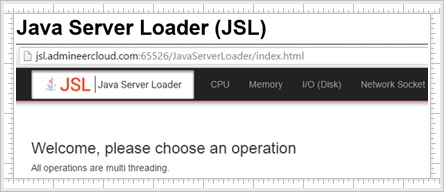
About JSL (Java Server Loader):
We developed this application for comparing servers, their hardware specs and reporting benchmark reports. JSL is able to run CPU, Memory, Disk, Network, Database performance tests and produce benchmark results. Its TPS results are very reasonable and we like to support our clients for their hardware purchase POCs and supporting them with a scientific view for their decisions.
Now I am going to share technical performance results for the iMac, then I will compare both hardware configurations with a summary table at the end. This method would be more scientific for buying a new hardware 🙂
CPU Results: Configuration-1 (27-inch iMac with Retina 5K Display – i5)
| Thread Count | Thread Per Second | Execution Time (ms) | Average Thread Time (ms) | System CPU Usage (%) | JVM CPU Usage (%) | Memory Usage (MB) | Processor Count |
| 4 | 0.3889158969372873 | 10285 | 10193 | 55.55144001991602 | 44.937749054473784 | 145.25428867340088 | 4 |
| 8 | 0.39331366764995085 | 20340 | 20151 | 70.91128498135228 | 58.09528775995481 | 159.54904079437256 | 4 |
| 12 | 0.40602266959905264 | 29555 | 29349 | 76.6487136862797 | 67.66585737673971 | 175.4078884124756 | 4 |
| 16 | 0.41385375442952843 | 38661 | 38481 | 81.26672398407277 | 72.51261931328169 | 194.96190071105957 | 4 |
| 20 | 0.4129842240026431 | 48428 | 48160 | 84.04216005055666 | 75.38408903015842 | 219.06800651550293 | 4 |
| 24 | 0.4132942999827794 | 58070 | 57603 | 86.3014415239784 | 77.18316451328062 | 252.26954746246338 | 4 |
| 28 | 0.4132719329318692 | 67752 | 67425 | 88.31892112792674 | 80.28353104376379 | 285.0838289260864 | 4 |
| 32 | 0.41561680130919293 | 76994 | 76617 | 89.33946596337809 | 81.36712617351365 | 142.56557941436768 | 4 |
| 36 | 0.4179097547101912 | 86143 | 85748 | 90.78845456534586 | 83.9443933696554 | 145.9521360397339 | 4 |
| 40 | 0.41752345959938625 | 95803 | 95140 | 91.11640914814872 | 84.2060627014152 | 184.3931369781494 | 4 |
CPU Results: Configuration-2 (27-inch iMac with Retina 5K Display – i7)
| Thread Count | Thread Per Second | Execution Time (ms) | Average Thread Time (ms) | System CPU Usage (%) | JVM CPU Usage (%) | Memory Usage (MB) | Processor Count |
|---|---|---|---|---|---|---|---|
| 4 | 0.5009392611145899 | 7985 | 7882 | 30.834053565019946 | 22.03705235492332 | 260.72339820861816 | 8 |
| 8 | 0.8823205029226866 | 9067 | 8964 | 49.69822068090664 | 45.555005430471276 | 290.6070919036865 | 8 |
| 12 | 0.9252833680314597 | 12969 | 12903 | 58.05911989742495 | 54.38671717218727 | 306.2667694091797 | 8 |
| 16 | 0.8597990219786125 | 18609 | 18491 | 65.72167966144768 | 60.27468743333701 | 140.9364891052246 | 8 |
| 20 | 0.8779631255487269 | 22780 | 22615 | 69.77619051737048 | 64.38297764980659 | 184.09584617614746 | 8 |
| 24 | 0.9117848187827673 | 26322 | 26197 | 73.81918297681555 | 70.06224502447583 | 218.4161605834961 | 8 |
| 28 | 0.914017105177254 | 30634 | 30383 | 76.22551270441382 | 73.27573622211764 | 183.80804252624512 | 8 |
| 32 | 0.9067724567866251 | 35290 | 35108 | 79.72376170633343 | 75.22209955326613 | 110.73560237884521 | 8 |
| 36 | 0.9073037955542115 | 39678 | 39502 | 80.28803945178394 | 77.36507817639252 | 150.24032402038574 | 8 |
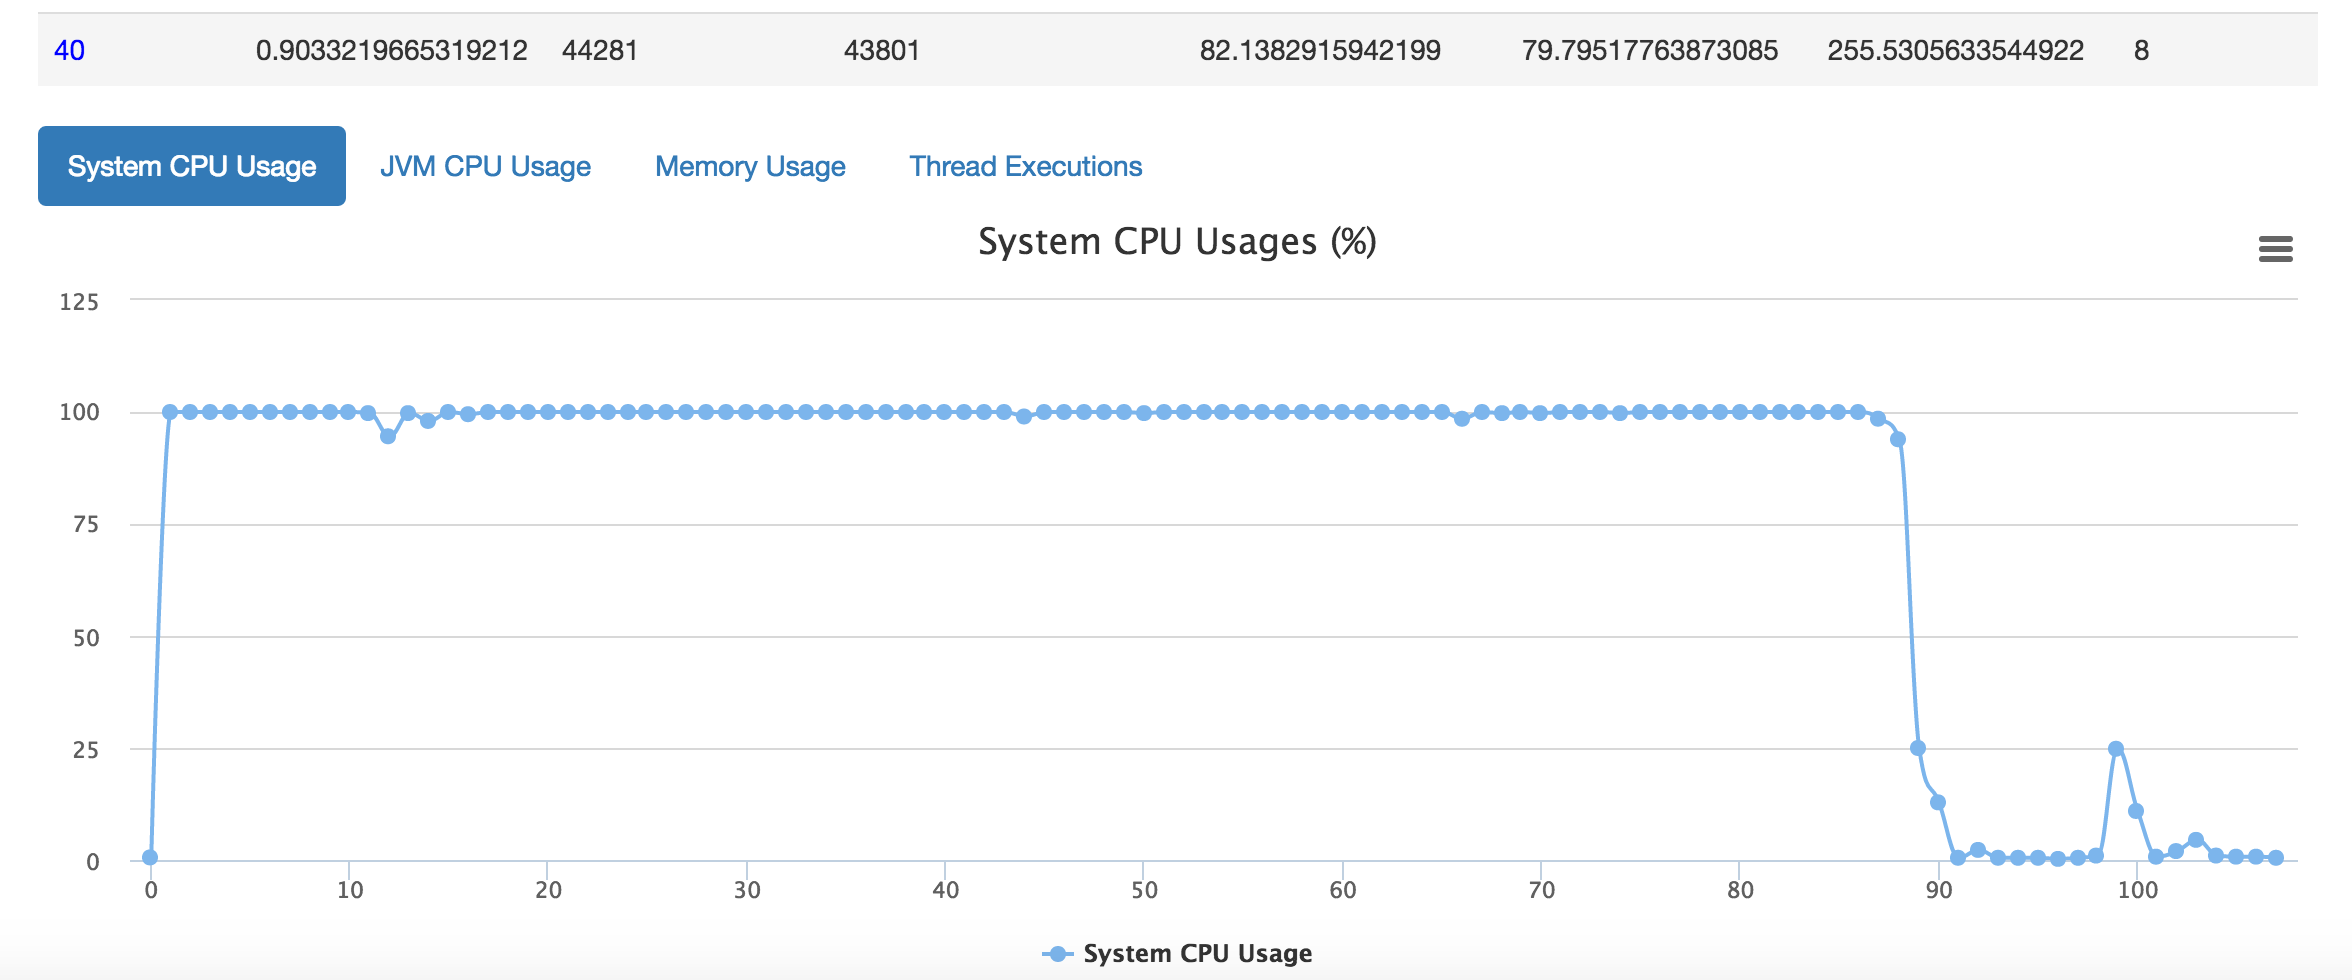
| 40 | 0.9033219665319212 | 44281 | 43801 | 82.1382915942199 | 79.79517763873085 | 255.5305633544922 | 8 |
IMPORTANT DIFFERENCE: Java sees 8 processor for Configuration-2:i7 and the number of virtual processor is 4 for Configuration-1:i5 (Check JSL’s benchmark results for “processor count” columns above)
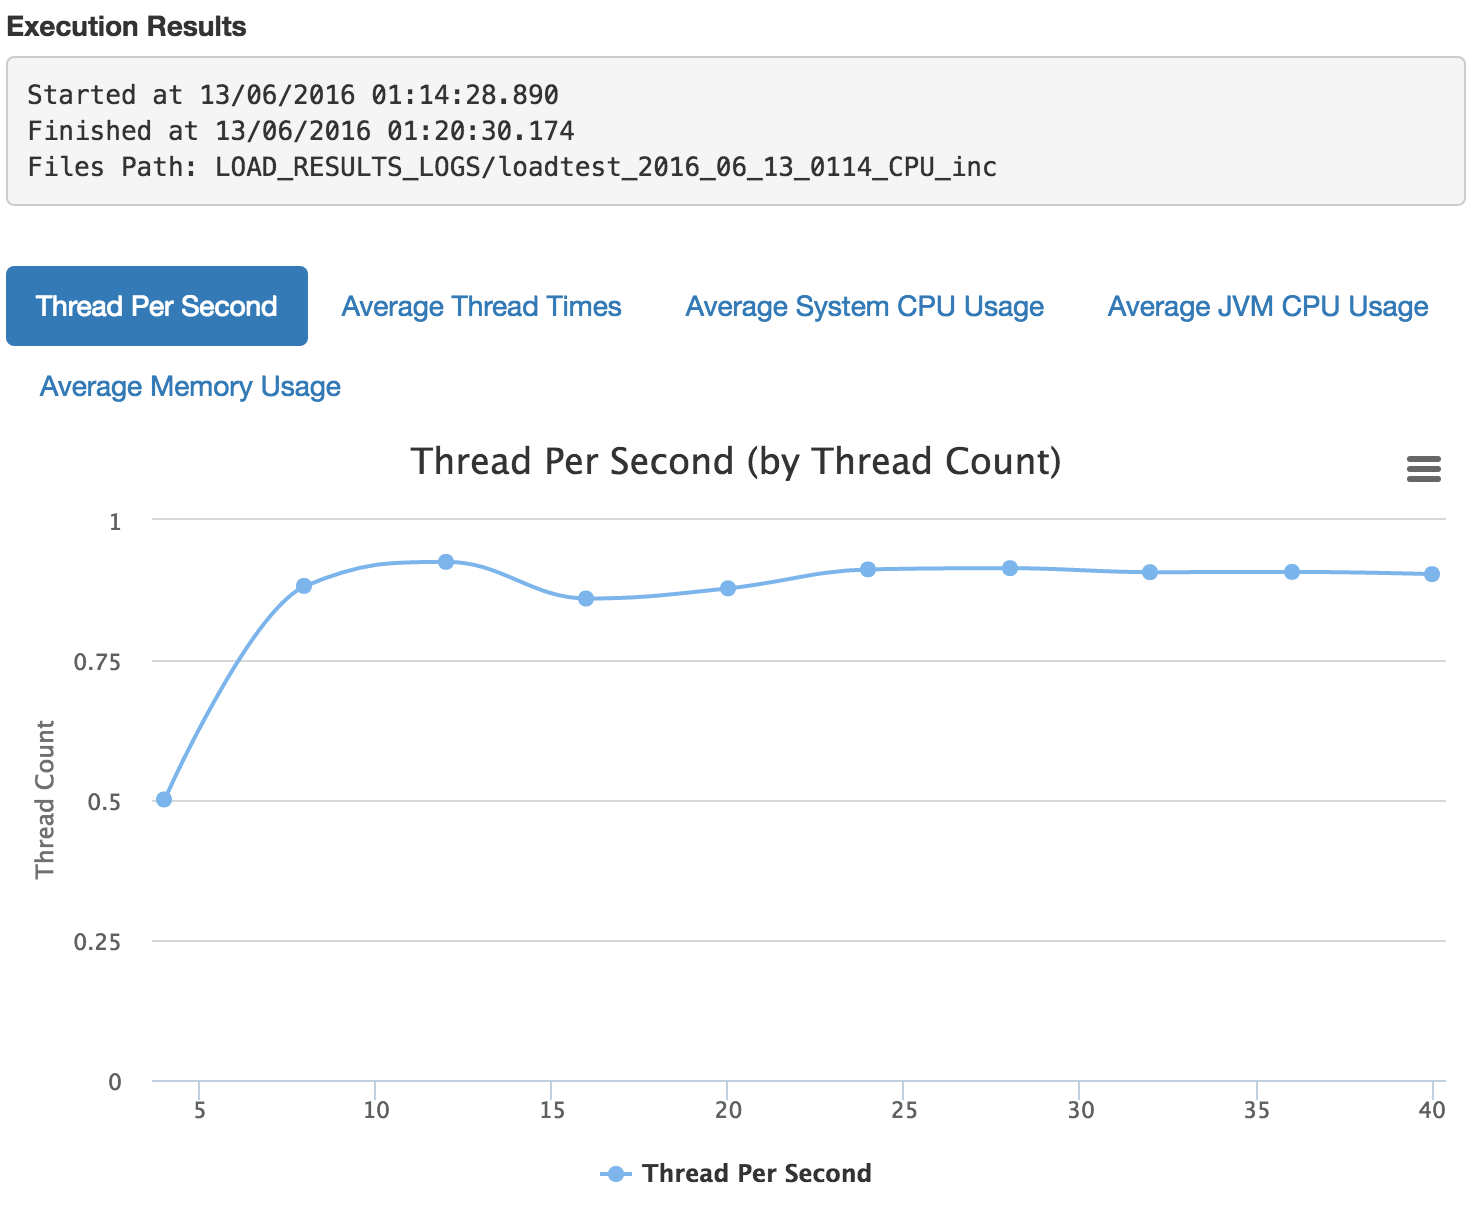
TPS (Transaction Per Second) Chart:
CPU Chart:
Let’s compare best CPU TPS results;
| Configuration | Thread | Best TPS (Thread Per Second) |
| iMac i5 3.2 GHz | 36 | 0.4179097547101912 |
| iMac i7 4.0 GHz | 28 | 0.914017105177254 |
Ultimate CPU Result: i7 is 2.187 (0.9140171/0.417909) times better than i5 !!!
I’ve done lots of hardware performance tests on both iMac configurations and prepared below summary result table. Let’s check the result table. I gave 1 point to the lower results and calculated second one’s point according to the lower TPS and assigned its multiplier (factor).
Overall Performance Results (Summary):
| Configuration | Hardware Test Type | Specs | Thread | Best TPS (Thread Per Second) | COMPARISON RESULT (p=point) |
| iMac i5 3.2 GHz | CPU | 3.2 GHz i5 | 36 | 0.4179097547101912 | 1p |
| iMac i7 4.0 GHz | CPU | 4.0 GHz i7 | 28 | 0.914017105177254 | 2.18p |
| iMac i5 3.2 GHz | Memory | 8 GB | 9 | 2.8239723878255400 | 1p |
| iMac i7 4.0 GHz | Memory | 8 GB | 9 | 5.22344747533372 | 1.84p |
| iMac i5 3.2 GHz | Disk (I/O) | 1 TB Serial ATA | 12 | 16.71309192200557 | 1p |
| iMac i5 3.2 GHz | Disk (I/O) | 512GB Flash Storage (SSD) | 36 | 116.88311688311600 | 6.99p |
| iMac i5 3.2 GHz | Network (Socket) | 10/100/1000BASE-T Gigabit Ethernet (RJ-45 connector) | 100 | 0.6500217757294869 | 1p |
| iMac i7 4.0 GHz | Network (Socket) | 10/100/1000BASE-T Gigabit Ethernet (RJ-45 connector) | 100 | 1.1926485145562753 | 1.83p |
Overall Performance Points and Results:
| Configuration | Total Performance Point | Price | Result |
| iMac i5 3.2 GHz | 4p | $1.799 | x Power |
| iMac i7 4.0 GHz | 12.84p | $2.749 | 3.21x Power |
As you see, iMac-i7 is x3.21 time powerful than iMac-i5 and the overall result and multiplier value (factor) really makes sense. According to the performance results, the price can be “$1799 x 3.21 = $5774”, but you are going to pay about $2.749 and for the long term usage you’ll save money and time.
My main purpose for using this iMac is “Oracle JDeveloper, Eclipse, WebLogic, JBoss, Tomcat, SOA technologies, preparing tutorial and educational documents… etc. That’s why I am highly recommending an “i7 over 3.2GHz, SSD Disk (must), minimum 8gb Memory” PC hardware to developers and middleware integrators.
If you want to see additional benchmark results for your hardware, please contact to me and give details about your environment. I am able to create any hardware performance tests, create benchmarks and generate fancy reports by using Java Server Loader.
Below YouTube tutorial is the summary screencast for my performance tests and also I explained some technical details about the JSL stress test methodologies.